How To View Website Statistics In cPanel?
Awstats is a free powerful and featureful tool that generates advanced web, streaming, FTP, or mail server statistics, graphically. This log analyzer works as a CGI or from the command line and shows you all possible information your log contains, in a few graphical web pages. It uses a partial information file to be able to process large log files, often and quickly. It can analyze log files from all major server tools like Apache log files (NCSA combined/XLF/ELF log format or common/CLF log format), WebStar, IIS (W3C log format), and a lot of other webs, proxy, wap, streaming servers, mail servers, and some FTP servers. Awstats helps you to view website statistics in cPanel.
Steps To View Website Statistics in cPanel
- Login to your cPanel account.
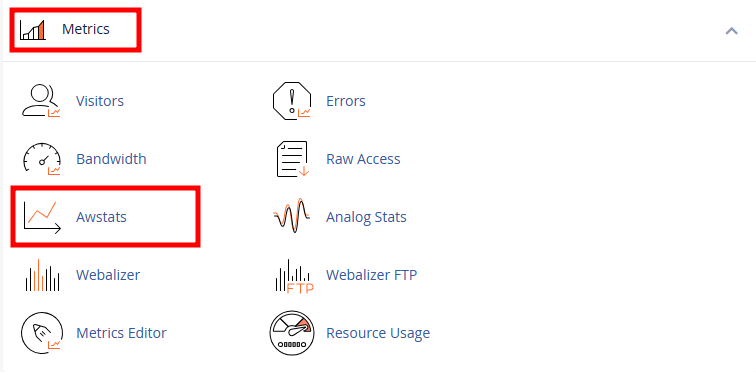
- Under the Metrics section, select the Awstats option.
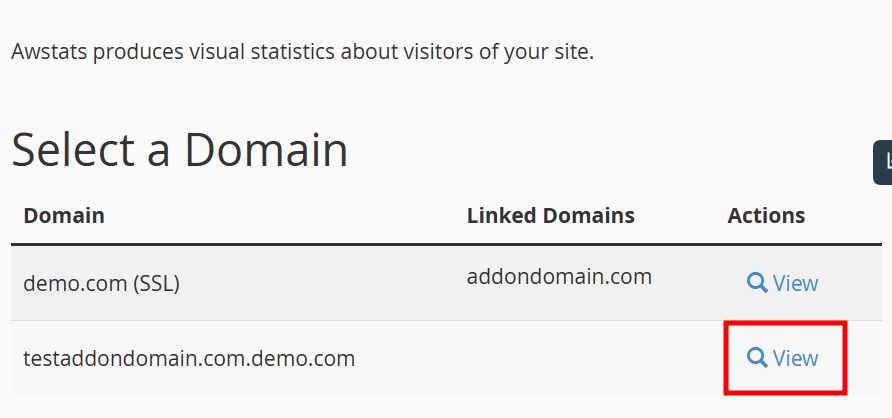
- In the new page, it will show you the list of all domains you have added to the cPanel account. Click on the View icon against the domain name for which you want to view the statistics.
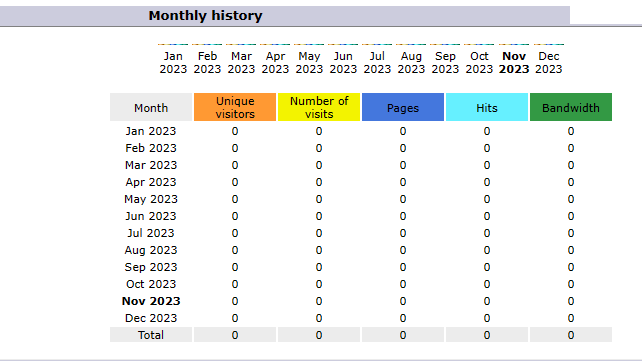
- You will now see the statistics data of the selected website. The default display is the current month’s data. However, you can generate reports for a particular month, days of the month, days of the week, etc.
That’s It! You can check out your website statistics in a few clicks.
If you enjoyed this tutorial, then you would love our support! All Kemuhost hosting plans include 24/7 support from our amazing support team. Check out our web hosting plans and have your website migrated for free today!

How To Install ClamAV Plugin From WHM?

How to Check Disk Space Usage of cPanel Accounts?

How To Modify The Maximum Number Of POP3 Connections In WHM Panel?
About Author
KemuHost Team
We are a team of Web Hosting Experts with decades of experience in Server Management and Web Hosting fields. We do perform thorough research on the web hosting trends and provide the best information to our users.