How To Monitor Resource Limit Information In cPanel?
At KemuHost, we use CloudLinux for our Linux Hosting plans. It allows monitoring the account resource usage that helps to improve server stability and performance.
If your account continuously hits the resource limit, it may go down and show a 508 error. In cPanel, you can view problematic processes and database queries that are running on your account. It allows you to know what is the reason for exceeding the resource limit. You can monitor resource limit information through cPanel.
Steps to View Resource Limit Information On cPanel
- Login to your cPanel account.
- Under the METRICS section, click on Resource Usage.
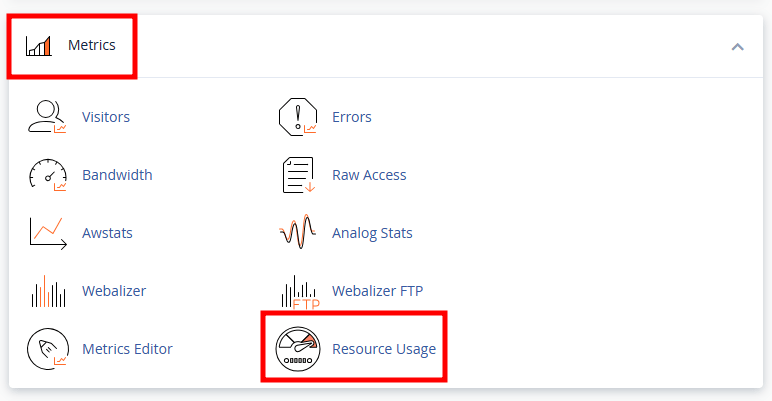
- In the Resource Usage page, the cPanel shows you the summary of your account with the details displayed below as per your account resource usage.
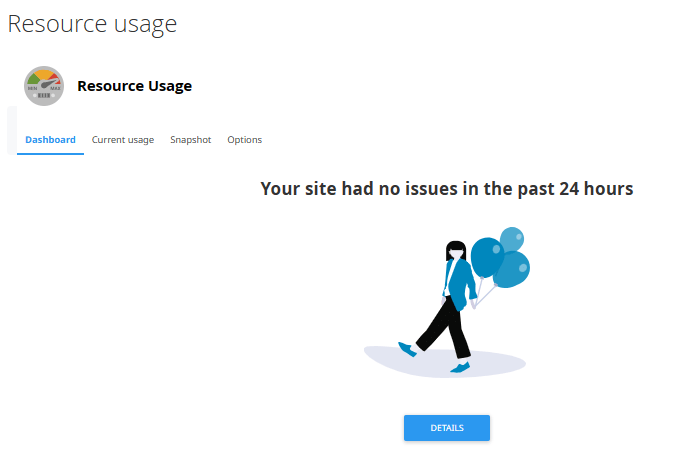
- Your site had no issues in the past 24 hours: If there are no triggers hit in the past 24 hours, you will see the below message.
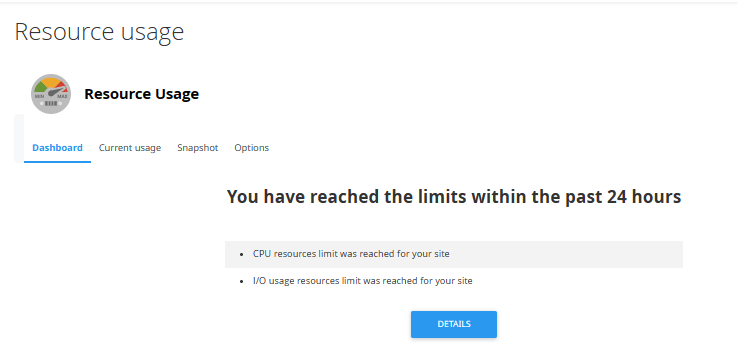
- You have reached the limits within the past 24 hours: This will display the resource limit hit in the past 24 hours with additional information that triggered the limit.
- Your site might hit resource limits soon: This message means that you are about to hit your account limit soon with additional information that might trigger the limit reached error.
- You can view details of resource usage of the cPanel account from the Current Usage tab. You will see a graph-based usage and usage table.
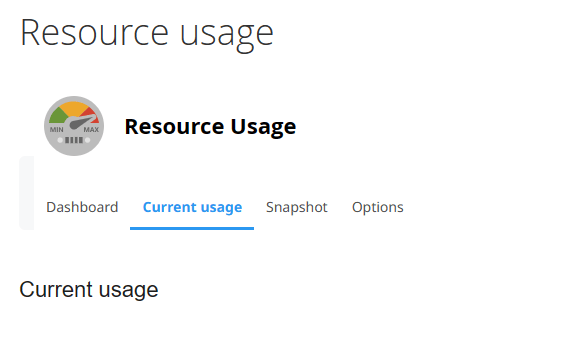
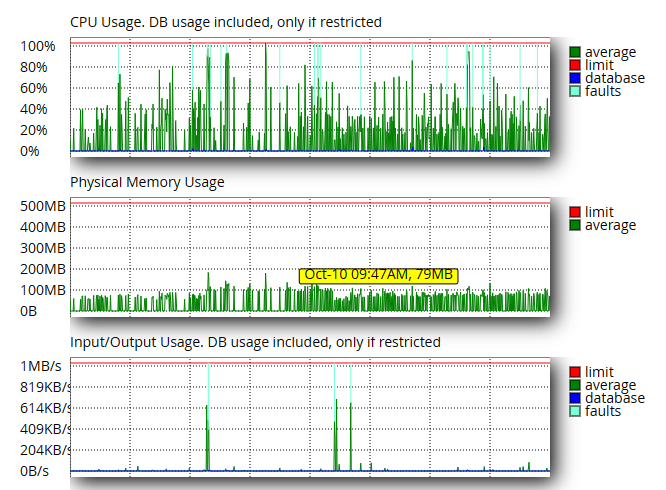
- Generally, cPanel shows the resource usage for the same day. You can change the time from the Timeframe button. Select the time as per your requirement. Using the Time Unit button, you can get the data between the selected time. It could be the day, hour, or minute.
- cPanel displays the list of processes and database queries in the snapshot tab. You can use the calendar to get the snapshot between two days.
How Does The Snapshot Helpful To Troubleshoot CPU Resources Limit?
Suppose a cPanel account resource monitor dashboard suggests that CPU resource has been limited for the past 24 hours. To view more information on this, you will need to click on the snapshot.
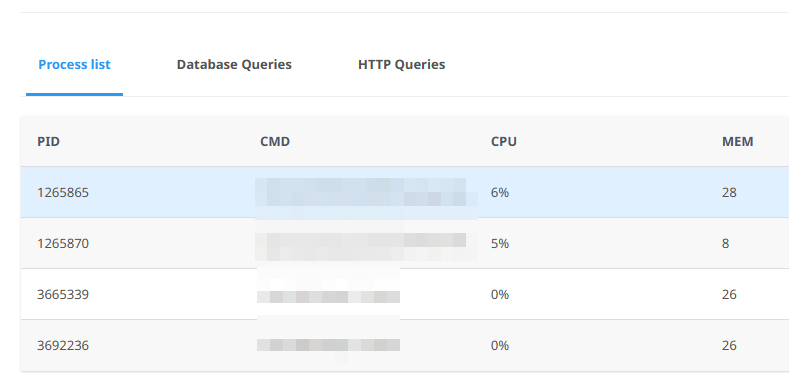
In the snapshot tab, you will find the below four details.
- PID: It shows the process ID.
- CMD: You can view the actual command running for that process ID.
- CPU: Total CPU usage for the process. Here, you will find an actual file that exceeds the CPU capacity. It will give you the number in percentage (%). What percentage of CPU usage is used?
- MEM: It will show the amount of memory the same process ID uses in MB.
Using this information, you can find out which process or file uses high CPU usage on your website. You can involve your developer and fix the code of that script. So it is always better to monitor resource limit information of your cPanel account.
If you enjoyed this tutorial, then you would love our support! All Kemuhost hosting plans include 24/7 support from our amazing support team. Check out our web hosting plans and have your website migrated for free today!

How To Generate CSR Key from WHM for SSL?

How To Disable Anonymous FTP In WHM Server?

What Is The Restricted Restore Feature In WHM?
About Author
KemuHost Team
We are a team of Web Hosting Experts with decades of experience in Server Management and Web Hosting fields. We do perform thorough research on the web hosting trends and provide the best information to our users.